Postgres Performance Monitoring with PgHero
In a previous role, I needed to optimize a Postgres database to store 2-3 billion total rows using an r4.xlarge instance on AWS RDS. This was storing weather data parameters for the world where parts were being updated every 5-15 minutes as new data came in, and old data needed to be removed. The total data stored was only for 2-3 weeks, so the whole database would be recycled with new data in that time frame. To better handle and understand changes, I needed a way to see how each query was performing, and how much of an impact to database server usage each was having.
What is PgHero
PgHero is a web based performance dashboard built on top of pg_stat_statements. pg_stat_statements tracks statistics of the SQL statements run on that server which can provide extremely valuable information when you are hunting down slow or unexpected database performance.
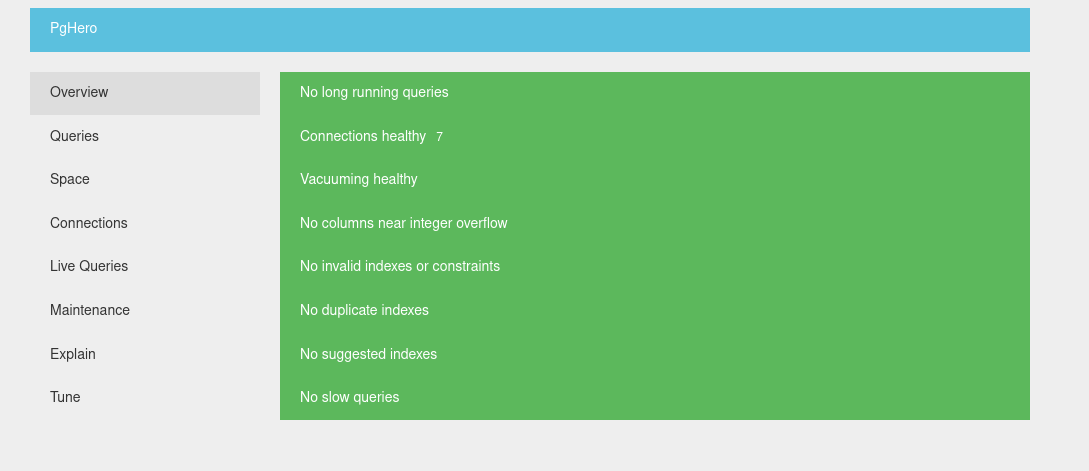
It may not be as pretty as AWS RDS Performance Insights, but it surfaces enough information along with helpful suggestions for reviewing the performance impact of your queries.
Example Weather Data
Here I’ve setup a Postgres instance with PgHero where I’ve generated ~125M rows in a single weather_record table with the following simple schema.
create table public.weather_record
(
    id           serial
        primary key,
    time         timestamp        not null,
    energy_delta double precision not null,
    ghi          double precision not null,
    temperature  double precision not null,
    pressure     double precision not null,
    humidity     double precision not null,
    wind_speed   double precision not null,
    rain1h       double precision not null,
    snow1h       double precision not null,
    clouds_all   integer          not null,
    latitude     double precision not null,
    longitude    double precision not null
);
The data takes a small dataset from Kaggle, and I just replicated the data with some randomness across the globe at a 0.5 degree interval.
My environment is setup with Docker Compose using the following PostGIS setup along with PgHero.
version: '3.8'

services:
  postgres:
    image: postgis/postgis:15-3.3
    environment:
      POSTGRES_USER: postgres
      POSTGRES_PASSWORD: postgres
      POSTGRES_DB: demo
      POSTGRES_INITDB_ARGS: "--data-checksums"
      POSTGRES_INITDB_WALDIR: "/var/lib/postgresql/wal"
      POSTGRES_HOST_AUTH_METHOD: "trust"
      # Enable required extensions and settings
      POSTGRES_SHARED_PRELOAD_LIBRARIES: "pg_stat_statements"
      POSTGRES_CUSTOM_CONF: |
        shared_preload_libraries = 'pg_stat_statements'
        pg_stat_statements.track = all
        pg_stat_statements.max = 10000
        track_io_timing = on
    ports:
      - "5435:5432" # 5435 to avoid conflicts
    volumes:
      - postgres_data:/var/lib/postgresql/data
    command: >
      postgres
      -c shared_preload_libraries=pg_stat_statements
      -c pg_stat_statements.track=all
      -c pg_stat_statements.max=10000
      -c track_io_timing=on
    healthcheck:
      test: ["CMD-SHELL", "pg_isready -U postgres"]
      interval: 5s
      timeout: 5s
      retries: 5

  pghero:
    image: ankane/pghero
    depends_on:
      postgres:
        condition: service_healthy
    environment:
      DATABASE_URL: postgres://postgres:postgres@postgres:5432/demo
    ports:
      - "8080:8080"

volumes:
  postgres_data:
Queries
Once the data is ingested, we can visit localhost:8080 to view PgHero, and navigate to the “Queries” tab.
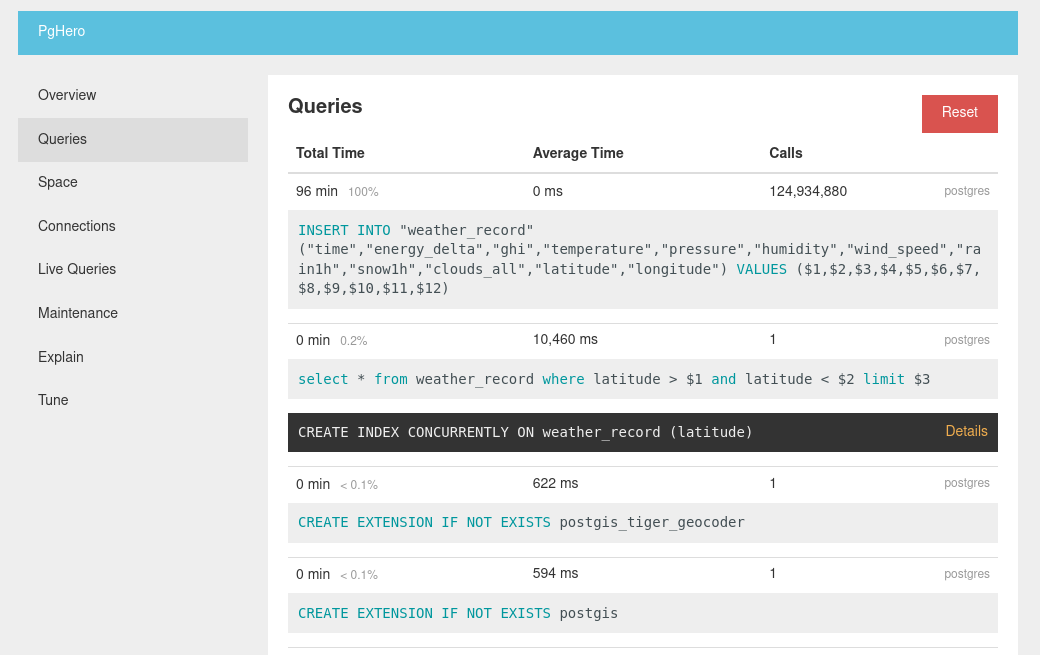
Then, without optimizing anything, I performed a single:
select * from weather_record where latitude > -40 and latitude < -39 limit 5;
This took ~10 seconds as we can see in the above PgHero screenshot. It also automatically suggests creating an index on latitude cause doing a full sequence scan on 125M rows is generally not a good ideal.
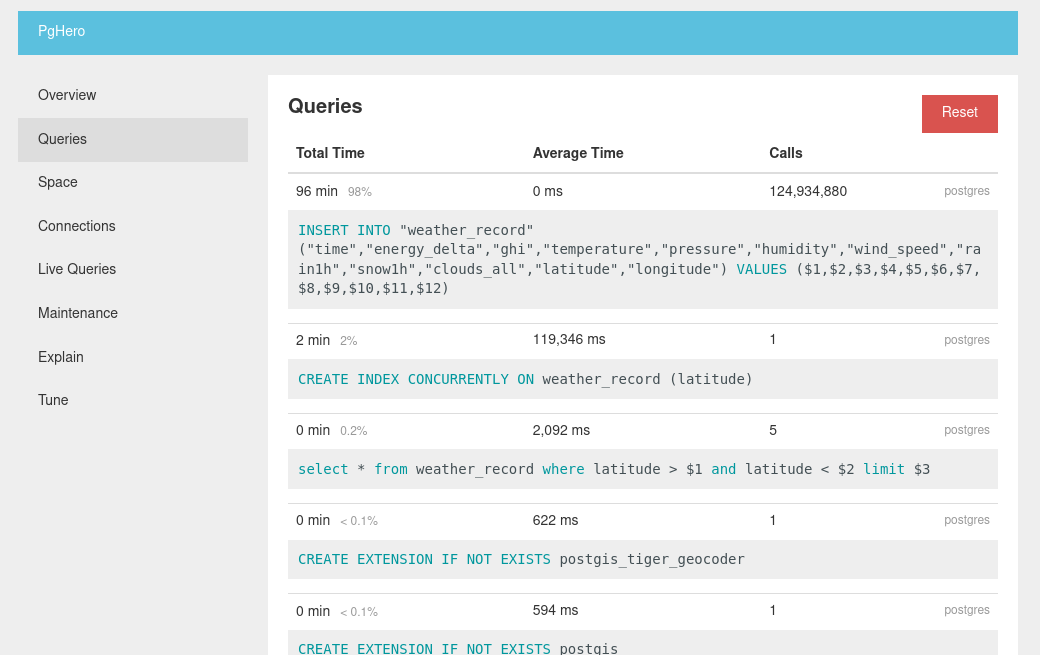
Running the suggested command, we can see the CREATE INDEX command also show up in our Queries, taking almost 2 minutes. Doing 4 more latitude queries our average drops from 10 seconds to 2 seconds. To get a more accurate picture we can click “Reset” at the top right to reset the stats and rerun the query.
Re-running the query and we get sub 1ms response times, and as we run more queries, this fast query will drop out of view since by the default it is sorted by total time impact by query. This is a small touch, but is a huge UX improvement since as working in a DevOps role, you can quickly Reset and monitor live queries and the most impactful queries appear at the top.
If we leverage PostGIS more effectively, we would add a geography(Point) column:
-- Add geography column
ALTER TABLE weather_record
ADD COLUMN geog geography(Point);

-- Populate it from lat/long
UPDATE weather_record
SET geog = ST_MakePoint(longitude, latitude)::geography;

-- Create index
CREATE INDEX idx_weather_record_geog
ON weather_record USING GIST(geog);
And query it using that index:
SELECT *
FROM weather_record
WHERE ST_DWithin(
    geog,
    ST_MakePoint(-30, 130)::geography,
    50000  -- meters
)
limit 5;
The pop-under suggestions can be great, especially for running this against a production database since if an index was missed, and live queries are impacted, these can ensure a quick turn around to resolving a performance issue. In my previous role, the team I led would deploy to production multiple times a day and we all had access to PgHero. So just after a deployment we could refresh this Queries view quickly to see if there were any obvious issues.
Also when ourselves or clients reported slowness in fetching data, we could check PgHero first to find or rule out obvious issues.
Explain
We can also use the Explain tab for both the original latitude query and another for longitude all from the built in web UI.
# Latitude with index present
Limit  (cost=0.57..1.07 rows=5 width=96)
  ->  Index Scan using weather_record_latitude_idx on weather_record  (cost=0.57..27799.85 rows=276180 width=96)
        Index Cond: ((latitude > '-40'::double precision) AND (latitude < '-39'::double precision))

# Longitude without index present
Limit  (cost=0.00..96.43 rows=5 width=96)
  ->  Seq Scan on weather_record  (cost=0.00..3922146.20 rows=203358 width=96)
        Filter: ((longitude > '-40'::double precision) AND (longitude < '-39'::double precision))
Straight away we can see the latitude query leverage the weather_record_latitude_idx index greatly reducing the cost of the query.
Space
Another useful tab is Space, which as the name suggests gives you a very simple report on a per table/index/materialized view reference to storage used. And just like the Queries tab, it is automatically sorted by largest ‘impact’ (in this case GB stored) by default.
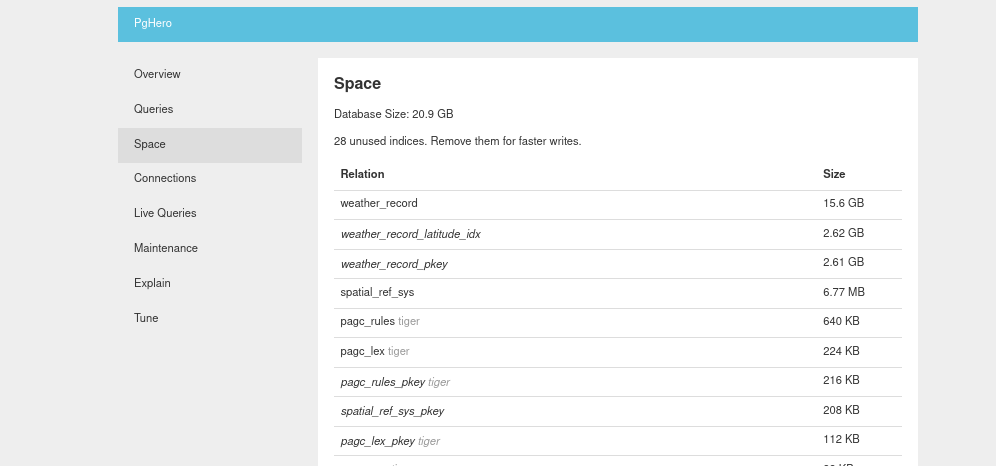
Space will also help you optimize indexes by tagging the ones that have never been used in a query.

Connections
The Connections tab is a simple view on total connections by user and location.
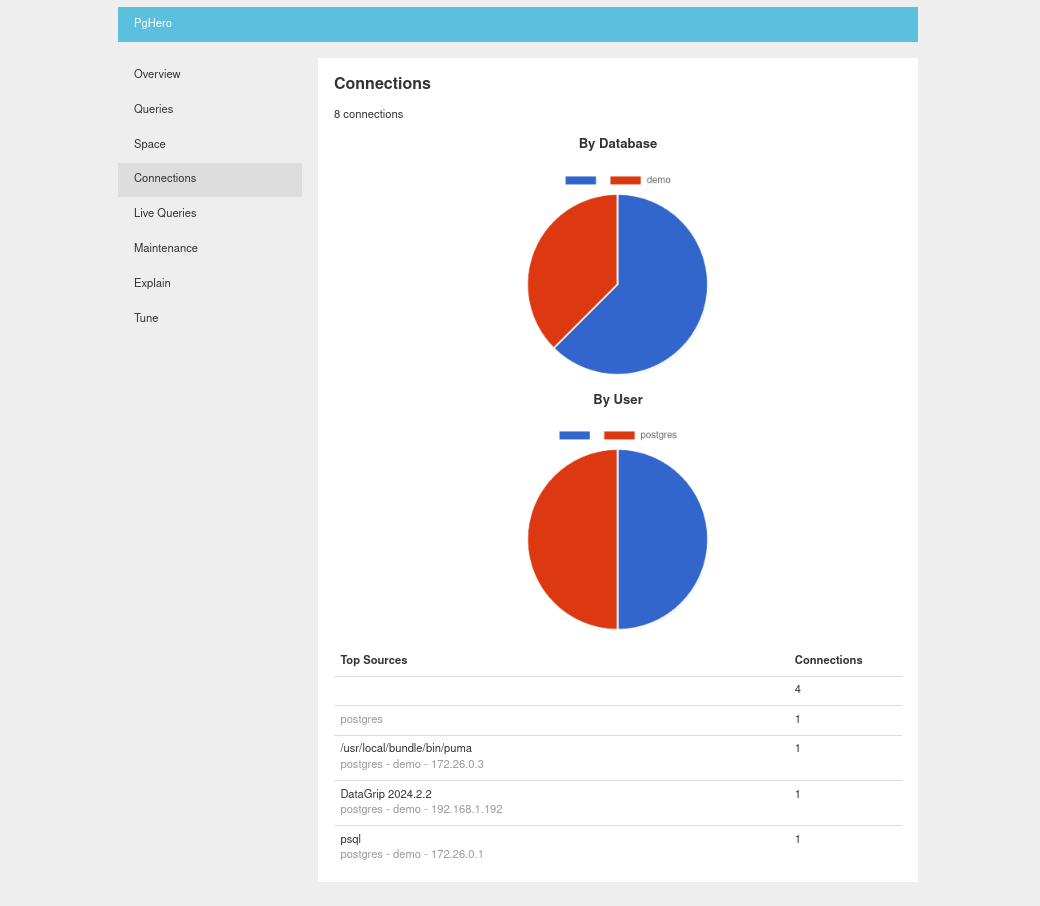
Here we can see a connection from PgHero itself (puma being the Ruby web process), along with a DataGrip and psql client connections.
Live Queries
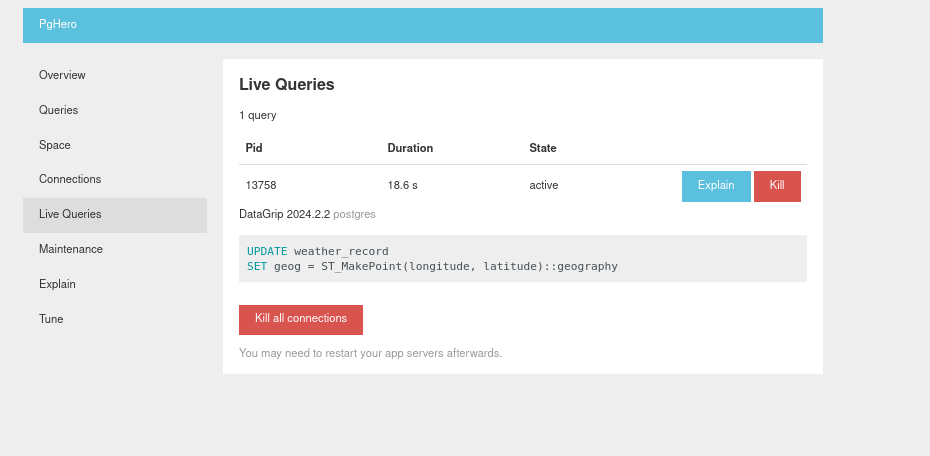
Live Queries enables the ability to kill long running statements which can be handy if mistakes have been made. A good example I experienced was running a CREATE INDEX statement that exceeded the server memory, forcing it to use paged memory tanking the performance. By monitoring a production Postgres instance using PgHero, where ever it might be hosted, you can at least more easily take action if things don’t go according to plan.
Maintenance
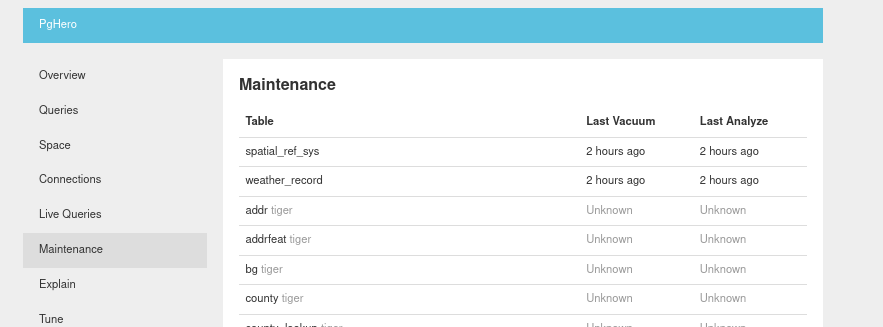
The Maintenance tab can help make it obvious why storage is not being reclaimed or optimizations not taking effect since we can see the “Last Vacuum” and “Last Analyze” columns.
Tune
This is a basic view of the current database configuration with a link to PgTune tool to give you rough ideas of options for database instance optimizations. This will be heavily dependant on your database usage characteristics like if you are read or write heavy, using shared storage or other environmental based context. Best try this kind of tuning in lower environments where possible since some changes will require instance process restarts.
If you are in a DevOps role, and looking for non-cloud tied tooling to assist with Postgres optimizations, PgHero is well work checking out!